Summary
With the US presidential election fast approaching1 in this piece we examine: (1) performance of asset classes over prior election cycles; (2) current polls; (3) key pillars of the Democratic and Republican election platforms; and (4) potential market impact.
1 Asset Class Performance Over Prior Election Cycles
Speculation is typically rife about the impact of upcoming elections – especially US elections – on financial markets. As an ex-post, stylized exercise, we reviewed the returns of key asset classes after US presidential elections. The results are presented in figure 1 where we plot the P&L of demeaned, daily log returns of US equities and the US dollar, as well as demeaned daily difference of the US 10-year yield 120-days immediately after election day2. With this approach, we observe the deviation of the asset classes from the average (0) or the ‘typical’ performance of the asset classes over any other given 120-days period.
2 Current Polls
The road to the Presidency is decided by seven swing states. The number of undecideds in each swing state are an important variable in determining the election outcome. Kamala Harris is polling within the margin of error in the majority of swing states. Post Biden stepping out of the Presidential race, the number of undecided voters in swing states has declined. Below we examine potential paths to the Presidency for Harris and Trump. Polls and betting markets suggest a tight race and a sweep (both houses) by either party is a lower probability outcome: the probability of a Republican sweep is higher given that it will be difficult to keep the Senate blue. The staggered voting in the Senate and subset of seats running makes it difficult for the Democrats to win the Senate. Twelve Senate seats are in play, eight are leaning Blue and four leaning Red4. The Democrats need to win ten of these seats to secure a tie, with the tie-breaking vote cast by the Vice-President. The more immediate risk to markets is the outcome of the Presidency. The Presidency has significant power to set policies on tariffs and immigration, while taxes and spending are initiated in the House and need to pass both chambers. With the Presidential race so close, a Democrat or Republican result has different outcomes for tariffs and immigration with important near-term market effects.
3 Election Platforms
We consider three potential election scenarios: (i) Republican or Democratic sweep; (ii) split houses; and (iii) disputed result. Both parties are campaigning on fiscal expansion platforms while promising to contain the US deficit. Each side blames the other for fiscal largesse and the rise in inflation. The composition of proposed spending and how it will be funded are key in assessing market impact.
Within political discourse, particularly in elections, promises of the candidates energize their respective political bases but are highly idealized. Passing campaign promises into law in their original form is extremely difficult, particularly with divided houses. For bipartisan issues where agreement is possible, reaching agreement involves several layers of compromise and negotiation as astute Washington operators attempt to negotiate good outcomes for their constituencies. In our discussion, we focus on the bigger, more predictable campaign pillars of each party and remind readers that the Presidency still carries significant power (e.g., immigration, tariffs) but requires Congressional consensus in other areas (e.g., taxes and spending).
3.1 Republican Platform
Major pillars of the Republican platform include: (i) extension of tax cuts; (ii) less regulation; (iii) increased tariffs; (iv) re-shoring; and (v) immigration reduction.
Taxes
Trump’s 2017 Tax Cuts and Jobs Act significantly changed the US tax code. Corporates rates were cut from 35% to 21% and individual income taxes were cut with the standard deduction increased. The household tax reforms are set to expire in 2025. Brookings5 estimates an extension of the tax cuts will cost $3.8tn over the next decade and assuming no significant cuts in services, increase debt-to-GDP to 211% by 2054. Trump has proposed cutting the corporate tax rate further from 21% to 15-20% and permanently extending tax cuts for individuals. Richard Katz estimates6 Trump’s policies will add $500bn or 2% to the US deficit annually. The US is already running a 6% deficit-to-GDP ratio, ahead of other developed countries. Trump’s proposed fiscal stimulus is inflationary and puts the US in a precarious fiscal position. President Clinton enacted an austerity program in the 1990s including spending cuts and tax increases to close a 5% deficit-to-GDP ratio. With the current fiscal trajectory, the US will eventually be forced to enact an austerity program.
Regulation
A Republican government will limit regulation and the reach of various regulatory agencies. Trump has stated he would fire the head of the SEC7 and supports the crypto industry. On balance, less regulation is positive for earnings and American corporations across several sectors including technology, energy, and industrials.
Tariffs
Trump believes that tariffs can fund budget deficits. Trump has proposed8 increasing tariffs on China to 60% and 20% on remaining trading partners. The impact of Trump’s tariffs which Biden maintained for China have been mixed at best. Large trade imbalances, particularly with China have not closed. Recent estimates from the Council on Foreign Relations9 show China running a record current account surplus, averaging $800bn over the last four quarters. The impact of tariffs is weakened as: (a) foreign currencies depreciate which partially offset the tariffs; (b) countries impose counter tariffs strategically targeting sectors that export to the US; (c) tariffs are circumvented via re-exporting (e.g. China exports components to Mexico for assembly), setting-up production in intermediary countries (e.g. China builds a factory in Thailand) and de-minimis rules which allow China to sell small packages10 into the US with no tariffs; and (d) tariffs increase the costs of intermediate goods. Steel tariffs for example increase input costs for US manufacturers and can reduce exports.
Tariffs are hard to police which allows trade imbalances to persist. They are inflationary and increase cost for American consumers. Tariffs is not an ineffectual policy tool, just inefficient. For example, tariffs are useful in highlighting trade abuse – in China’s case, large manufacturing subsidies which allow domestic producers to undercut competitors in international markets.
Re-Shoring
Republicans want to reshore manufacturing to the US and view tariffs and a weak US dollar as levers to achieve this objective. As discussed, tariffs at best have a muted impact on the US economy. Weakening the dollar is even more challenging. The primary levers to weaken the dollar include: (a) establish a second Plaza Accord. This involves coordination with large, friendly trading partners. Trump wants to reduce the reach of the US in global affairs making this difficult; (b) lower interest rates to weaken the US dollar – a challenge with a responsible, inflation fighting Central Bank and the proposed fiscal stimulus; (c) moral suasion. Trump can try to influence the Federal Reserve by criticizing high interest rates. He also floated the idea of Presidential involvement in the rate setting process; (d) capital tax on foreign inflows into US markets. Difficult pitch to Republicans and negative for financial markets. Michael Pettis argues11 a capital tax is an efficient policy tool to close large trade imbalances but comes at the cost of hurting financial assets; and finally (e) tariffs which we argue are inefficient.
Immigration
Trump has proposed restricting immigration and deporting undocumented immigrants. The US labor market is tight, particularly in labor-intensive-service sectors12. With the economy close to full employment, reductions in legal and illegal immigration are inflationary via the wage channel.
3.2 Democrat Platform
Similar to the Republicans, fiscal policy is an important part of the Democratic platform. The parties differ in how spending will be funded and how the money is spent. Major pillars of the Democratic platform include: (i) higher taxes; (ii) more regulation; and (iii) industrial policy.
Taxes
The Republicans are proposing funding spending with tariffs. Democrats will increase taxes. Harris is considering increasing the corporate tax rate to 28%13 from the current 21% rate. Individual tax rates will increase for the affluent but households earning below $400k will be exempted. Taxes and spending are initiated by Congress with Trump’s tax cuts set to expire in 2025.
Regulation
The Democrats will take a more active approach to regulation than Republicans. This includes more antitrust enforcement, scrutiny of monopoly power and more regulatory pressure on various sectors including technology and energy. Regulatory costs for US corporations will rise.
Industrial Policy
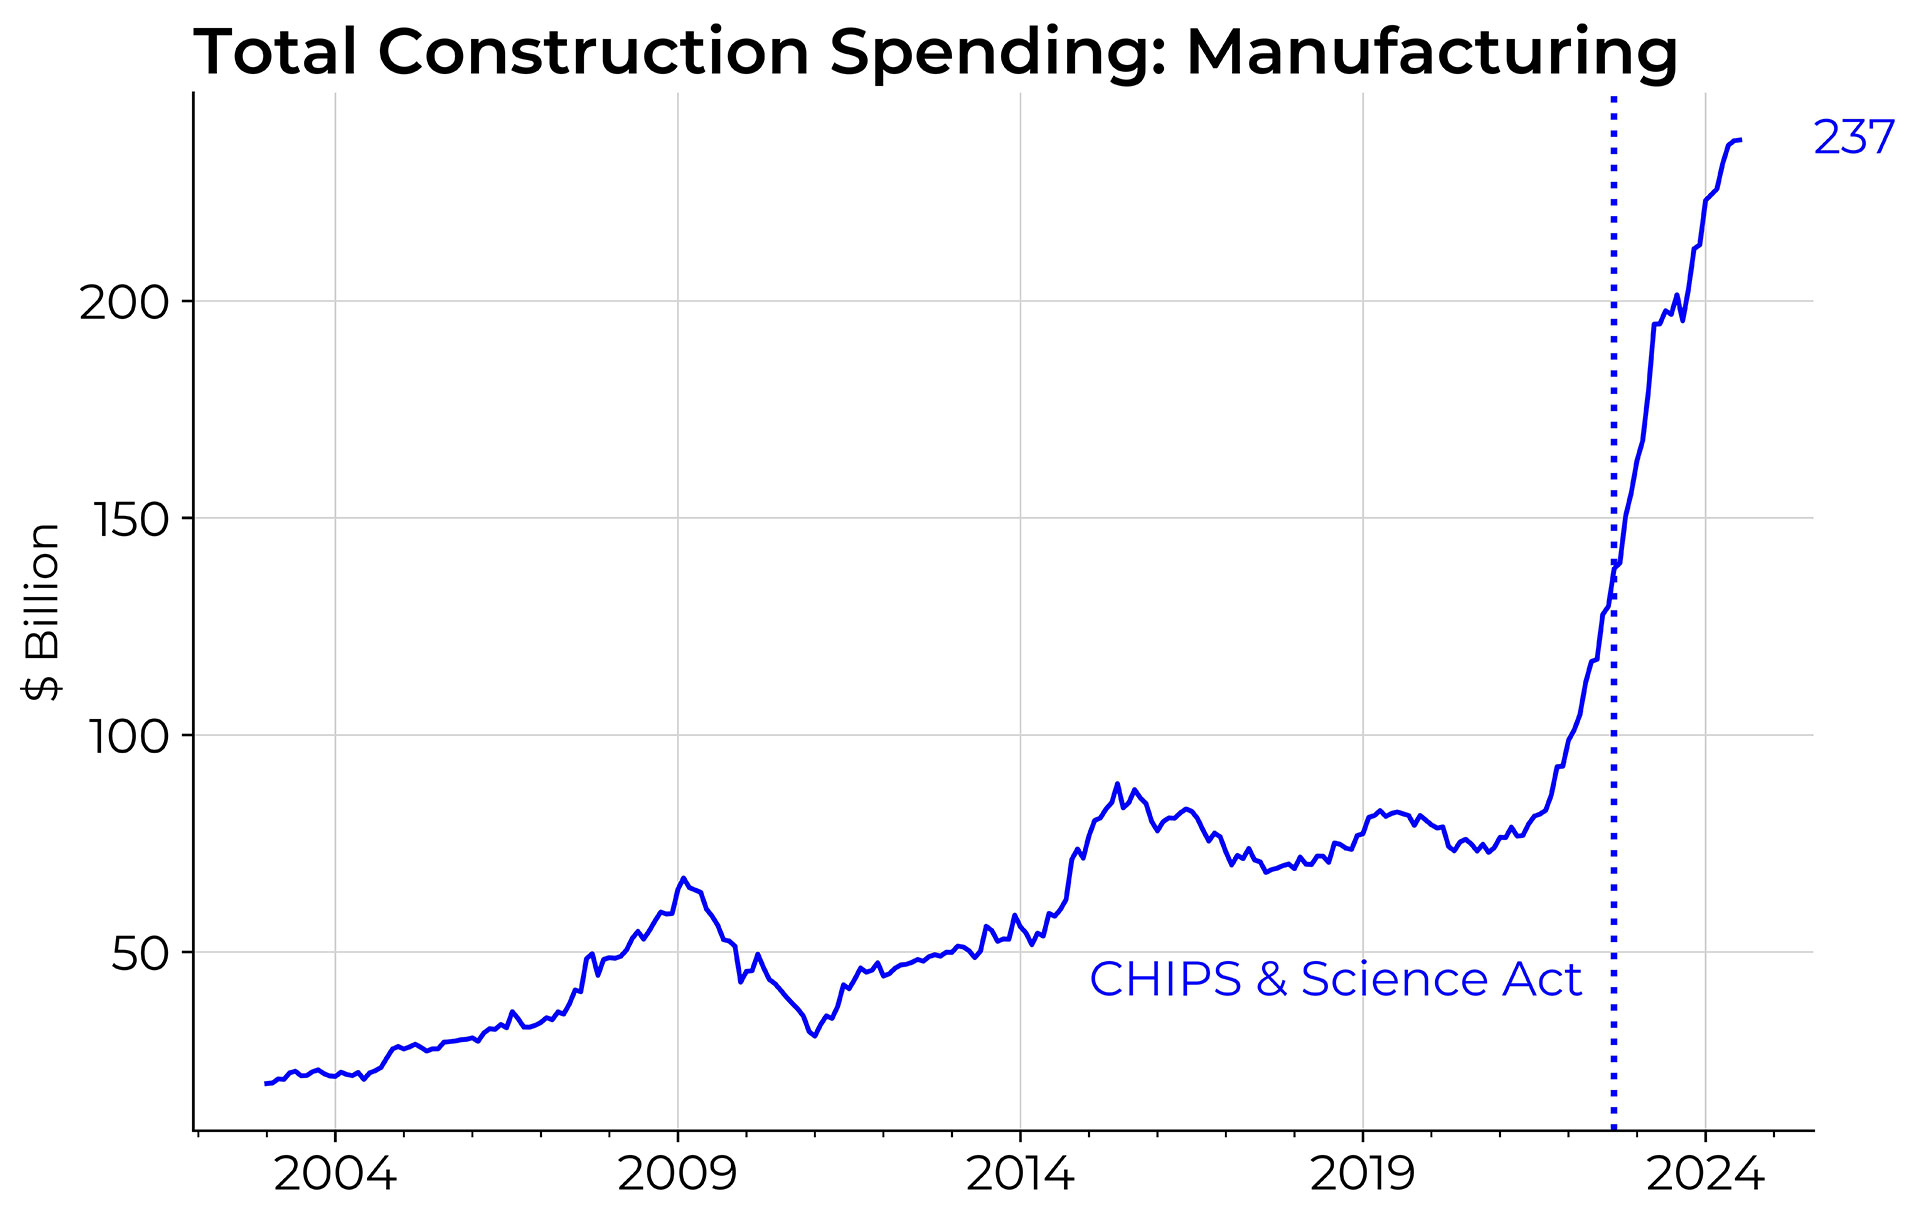
Part of the Democrats fiscal spending will be directed to industrial policy. Biden passed the Inflation Reduction Act (“IRA”)14 and the CHIPS and Science Act (“CHIPS”)15 in 2022. The IRA provides subsidies for green investment in the US including solar, nuclear, electric vehicles and power. The CHIPS Act is a form of re-shoring providing subsidies to semiconductor manufacturers to build fabs in the US. The CHIPS Act had bi-partisan support and several projects are now under construction.
The tables present a rough assessment of potential price action in various scenarios. A Republican sweep is positive for markets with expected price action similar to Trump’s 2016 sweep. A Democratic sweep and dispute will weigh on risk assets. The modal scenario is a split Congress which should support risk assets as the market discounts less extreme policy outcomes and moves past the event risk. The outcome of the Presidency will trigger rotation within asset classes given the differentiated party views on tariffs and immigration policy. This is the most immediate risk given tight polls. For example, Trump’s proposed tariffs will weigh on the FX of large trading partners and are potentially inflationary which can weigh on bonds and reprice short term rates for a less dovish cutting cycle. In the lower probability sweep scenarios, heavy rotation within asset classes is expected as the market discounts the key policy initiatives of each party.
Democrat Sweep
The Democratic platform benefits individuals at the expense of corporates and the affluent. Higher corporate taxes and regulation will weigh on earnings and equities. The Democratic fiscal platform is more austere than the Republican proposal and tax increases, as opposed to tariffs are a more viable policy to fund spending increases. The redistribution platform is less stimulative and pulls forward the odds of a US recession.
Republican Sweep
A Republican sweep is inflationary and market friendly. Asset prices will follow a similar dynamic to Trump’s 2016 sweep. Equities rally, bonds selloff and the US dollar strengthens on strong economic prospects. Trump’s proposed tax cuts are a large fiscal stimulus with consequences for inflation and the Federal Reserve reaction function. Corporate earnings will benefit from current or lower corporate tax rates and significantly less regulation. Similar to 2016, energy and financials will benefit from a Republican sweep, but clean energy sectors and adjacent themes will underperform as spending and incentives for the sector are reduced. The Republican’s large fiscal impulse has a cost in the form of ballooning deficits and rising interest rates. In October 2023, prior to the Fed’s pivot, risk assets underperformed as US 10-year yields approached 500-bps. A similar scenario for investors is possible under a highly stimulative Republican platform.
Split
Increasing fiscal stimulus is now a bipartisan policy. In a split scenario fiscal spending continues but the distribution of spending changes with each party looking to secure funds for various initiatives. Compromises will happen on both sides similar to the deal struck to pass the budget and sign the CHIPS act. A split election outcome makes it harder to pass major policy initiatives on both sides. A weakening or removal of the most extreme policy ideas on each side is positive for markets and investor sentiment. The Democrat and Republican parties are more aligned than the news would have you believe. Passage of the CHIPS Act is an example of a bipartisan effort in a split Congress. The parties are also aligned on China, with Biden maintaining then increasing Trump’s initial round of China tariffs.
Dispute
A disputed election result is negative for risk assets and will trigger a flight to quality. A delay in the transition of power, questions around election legitimacy and the resilience of US institutions will weigh on investor sentiment.
Key Takeaways
1. The US election remains a close race. The likely outcome is a split Congress – a market friendly event.
2. The Presidency is determined by undecided voters in seven swing states.
3. Fiscal continues irrespective of the party in power16 and a sweep or split election outcome.
4. Fiscal is inflationary. A negative for bonds and keeps the Federal Reserve cautious (higher for longer).
5. The composition and funding of spending is different in each election outcome.
6. A Republican sweep (unlikely) will use tax cuts and tariffs as its primary fiscal levers and shift spending away from green energy sectors.
7. A Democratic sweep (unlikely) will use tax increases directed at corporates and the affluent to fund spending. Fiscal spending will focus on individuals and green energy sectors.
8. In a split outcome (likely), fiscal stimulus continues via a process of negotiation between the parties but cancels or weakens more extreme policy proposals.
9. The Presidency has significant power to set policies on tariffs and immigration, while taxes and spending are initiated in the House and need to pass both chambers. The race for the Presidency is even odds, a Republican or Democrat President has important near-term asset price impacts.
10. The Democrat and Republican parties are more aligned than the news would have you believe. Passage of the CHIPS Act and alignment on China are examples of impactful bipartisan efforts in a split Congress.
11. A disputed election outcome is negative for risk assets and triggers a flight-to-quality.
1 Tuesday, November 5th, 2024
2 Our proxies are the Dow Jones Industrial Average (INDU Index) for equities, the yield of the US 10-year Treasury (USGG10YR Index) and the DXY Index. We use the Dow Jones to extend the historical look-back.
3 The date of US elections is statutorily set as being “the Tuesday next after the first Monday in November”.
4 Bloomberg Finance LP
5 https://www.brookings.edu/articles/what-will-happen-to-the-trump-tax-cuts-in-2025-and-how-will-they-affect-the-national-debt/
6 https://richardkatz.substack.com/p/japans-trump-economy-shock-if-he
7 https://www.bloomberg.com/news/articles/2024-07-27/trump-pledges-to-fire-gensler-pick-regulators-who-love-crypto
8 https://www.forbes.com/sites/alisondurkee/2024/08/19/will-trumps-tariffs-raise-prices-what-to-know-as-kamala-harris-slams-trump-tax/
9 https://www.cfr.org/blog/chinas-current-account-surplus-likely-much-bigger-reported
10 Chinese e-commerce PDD Holdings operates Temu, a direct-to-consumer shipping business which offers heavily discounted goods.
11 https://www.bloomberg.com/view/articles/2019-08-01/trade-deficit-could-be-reduced-under-baldwin-hawley-senate-bill
12 https://richardkatz.substack.com/p/japans-trump-economy-shock-if-he
13 https://www.reuters.com/world/us/harris-calls-raising-us-corporate-tax-rate-28-percent-2024-08-19/
14 https://en.wikipedia.org/wiki/Inflation_Reduction_Act
15 https://en.wikipedia.org/wiki/CHIPS_and_Science_Act
16 See “Fiscal Addiction” https://www.cfm.com/fiscal-addiction/
DISCLAIMER
ANY DESCRIPTION OR INFORMATION INVOLVING MODELS, INVESTMENT PROCESSES OR ALLOCATIONS IS PROVIDED FOR ILLUSTRATIVE PURPOSES ONLY AND DOES NOT CONSTITUTE INVESTMENT ADVICE NOR AN OFFER OR SOLLICITATION TO SUBSCRIBE FOR ANY SECURITY OR INTEREST. ANY STATEMENTS REGARDING CORRELATIONS OR MODES OR OTHER SIMILAR BEHAVIORS CONSTITUTE ONLY SUBJECTIVE VIEWS, ARE BASED UPON REASONABLE EXPECTATIONS OR BELIEFS, AND SHOULD NOT BE RELIED ON. ALL STATEMENTS HEREIN ARE SUBJECT TO CHANGE DUE TO A VARIETY OF FACTORS INCLUDING FLUCTUATING MARKET CONDITIONS AND INVOLVE INHERENT RISKS AND UNCERTAINTIES BOTH GENERIC AND SPECIFIC, MANY OF WHICH CANNOT BE PREDICTED OR QUANTIFIED AND ARE BEYOND CFM’S CONTROL. FUTURE EVIDENCE AND ACTUAL RESULTS OR PERFORMANCE COULD DIFFER MATERIALLY FROM THE INFORMATION SET FORTH IN, CONTEMPLATED BY OR UNDERLYING THE STATEMENTS HEREIN. CFM ACCEPTS NO LIABILITY FOR ANY INACCURATE, INCOMPLETE OR OMITTED INFORMATION OF ANY KIND OR ANY LOSSES CAUSED BY USING THIS INFORMATION. CFM DOES NOT GIVE ANY REPRESENTATION OR WARRANTY AS TO THE RELIABILITY OR ACCURACY OF THE INFORMATION CONTAINED IN THIS DOCUMENT.


