Summary
Recession calls in 2023 were commonplace with many commentators highlighting the predictive properties of yield curve inversion. We are now into the longest yield curve inversion in history with a recession yet to materialize for the US economy. The conventional economic argument is higher rates increase the cost of capital for leveraged entities which slows or reverses investment in capital and labor, reduces borrowing and consumption, and triggers bankruptcy for weaker firms cooling overall economic growth.
In this note we discuss some interesting arguments as to why the transmission of US monetary policy to the economy is slower this cycle. We argue the transmission channels are not broken, just slower due to structural features of the US economy.
Sensitivity of the Economy to Interest Rates
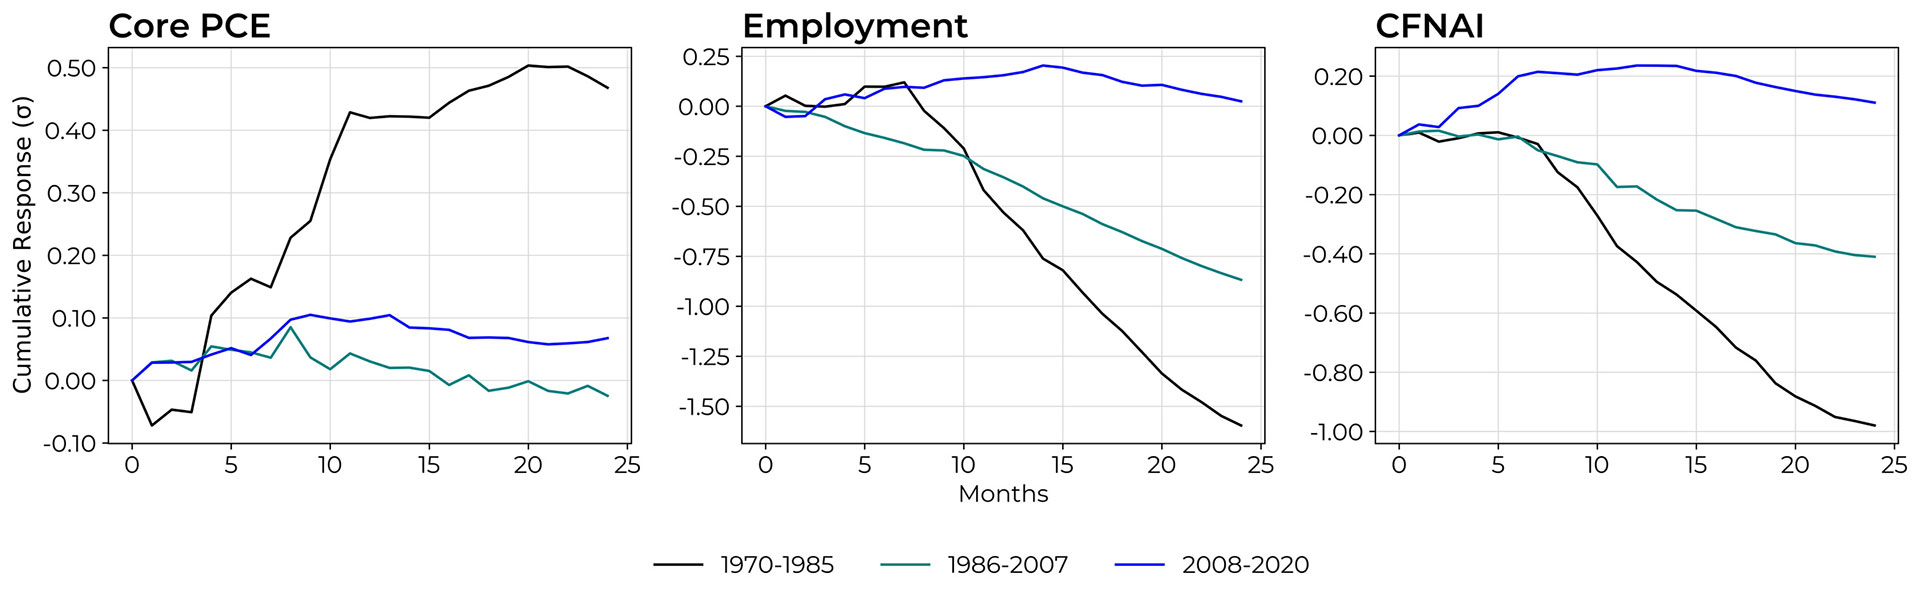
There is ample literature about the shifting effects of monetary policy on the real economy. To illustrate, we show the response of US employment, inflation and the Chicago National Activity Index (CFNAI) to monetary policy following but extending a procedure by the Federal Reserve Bank of Kansas City1. Figure 1 below shows the results of an increase in the US Federal Funds rate on these three variables, over three time periods using a model in economics called a vector autoregression model2 (VAR). Going into the details of the model is beyond the scope of this note, but it suffices to know that this model captures the changing relationship between multiple quantities over multiple lags over time. There was a significant response by all three elements in the pre-1985 period, while the response (sensitivity) to a change in monetary policy – while still present – is much more muted, and also comparable across the periods after. The results suggest a weakened transmission mechanism in monetary policy’s influence on employment, inflation, and economic activity. The Kansas City Fed posits that a probable reason for this reduced sensitivity include shifts in monetary policy behavior (especially after the volatile 1970 to early 1980s period), innovations in financial markets, and structural changes within industries.
Below we explore additional arguments market participants have raised to explain slower rate transmission this cycle.
Regime of Abundant Reserves
On October 3rd, 2008, during the Global Financial Crisis (GFC), the Fed started paying interest on excess reserve balances3 and required reserves. The change shifted control of short-term rates to the Fed’s balance sheet. The Fed engaged in quantitative easing (QE) programs and other accommodative monetary policies which reduced long term interest rates. The Fed also expanded participation in its repo facilities to money market funds in mid-2017. As a result of these policies, reserves in the financial system increased significantly. Abundant reserves increase liquidity and reduce the volatility of funding rates. The primary function of financial institutions is maturity transformation – borrowing short term to lend long term. The Fed’s shift to an abundant reserve regime for better control of short-term rates has allowed financial institutions to continue extending credit even as the Federal Reserve hiked policy rates, slowing the overall transmission of higher rates to the economy.
Wages, Wealth Effects & Age Cohorts
Spending by older cohorts is rising. The 65+ cohort accounts for over 21%4 of consumer spending. Older cohorts are the largest beneficiaries of rising equity and home prices, are less rate sensitive and can now invest excess savings in risk free bills yielding over 5%. The wealth and income effects flow into spending channels and keep wages and inflation elevated. The counterintuitive implication is higher policy rates are inflationary5.
Corporate Issuance
Transmission of higher policy rates to US corporate borrowing has been limited. Since 20136, 61% of investment grade issuance and 68% of high yield issuance occurred with Fed Funds below 1%. In addition to locking attractive rates, corporates significantly increased total issuance during the Covid pandemic. According to the Securities Industry and Financial Markets Association (SIFMA), total corporate bond issuance in the US reached $2.1 trillion in 2020 – a significant increase from the $1.3 trillion average per year in the preceding 5 years7. Large issuance adds liquidity to the financial system and contributes to inflationary pressure via the demand-pull channel. However, shorter corporate maturities imply rollover risk and looming maturity walls. Higher policy rates eventually transmit via higher cost of capital and pressure corporate balance sheets. Rising cost of capital is partially offset by insatiable investor demand for credit keeping spreads tight and giving borrowers flexibility on terms.
Mortgages
The availability of fixed rate, long dated mortgages in the US dampens the transmission of policy rates. A recent analysis8 showed most US mortgages struck at rates below 4%, protecting homeowners from rising interest rates. Homeownership rates in the US are above 65%, reducing the impact of the Fed’s tightening for a significant percentage of borrowers. The 30-year fixed rate mortgage is a particular feature of the US economy. Mortgage markets in other countries tend to offer shorter terms creating rollover risk for borrowers, higher interest rate sensitivity and significant maturity walls.
Renters, new home buyers and households that need to move face significantly higher sensitivity to interest rates. In the case of renters, leveraged asset owners pass through higher borrow and maintenance costs to maintain positive yields and helps explain part of the global rise in rents. For new home buyers, higher borrow cost constrain builders’ ability to add new housing supply, further pressuring prices and rents higher.
Capex Intensity
The importance of the technology sector to the US economy has grown rapidly representing 33%9 of the SPX index. The highly scalable, capex lite, cash flow generative business models of the large, incumbent technology firms have reduced the sensitivity of the US economy to interest rates. Services are also an important contributor to the US economy, tend to have lower capex and less sensitivity to interest rates. Interestingly, capex at the incumbent technology firms is expected to rise materially as they make large investments in computation to build technologies around the generative AI boom10. Additional borrowing demands to fund the AI buildout will increase the interest rate sensitivity of the technology sector.
Key Takeaways
Monetary policy transmission is not broken, just slower. Higher policy rates still work and eventually slow the economy.
Potential explanations for the slower transmission of monetary policy and the US economy’s reduced sensitivity to interest rates include:
- A general, reduced sensitivity of the economy to interest rates likely on account of shifts in monetary policy behavior, innovations in financial markets, and structural changes within industries. This, incidentally, forms a major part of the forthcoming Jackson Hole conference in August where the theme is “Reassessing the Effectiveness and Transmission of Monetary Policy.”11
- An abundant reserve regime post-GFC allowed financial institutions to continue extending credit as the Fed hiked rates.
- Rising spending from less rate sensitive, wealthier, older cohorts who benefit from higher asset prices and yields.
- Majority of corporate issuance since 2013 occurred when Fed Funds was less than 1%. The size of issuance rose significantly during Covid as well.
- Large percentage of residential mortgages fixed at lower rates.
- Capex intensity of the US economy has declined with the rise of the technology and service sectors.
1 Has the U.S. Economy Become Less Interest Rate Sensitive? Willis, Jonathan L., and Cao, Guangye 2015
2 Time Series Analysis. James D. Hamilton 1994
3 Emergency Economic Stabilization Act of 2008
4 Source: BlackRock. Bureau of Labor Statistics, data as of December 31, 2022
5 Proponents of Modern Monetary Theory (MMT) advance this argument.
6 Source: BlackRock. Bloomberg. As of March 31, 2024
7 Data from SIFMA: https://www.sifma.org/resources/research/us-corporate-bonds-statistics/
8 Source: Bloomberg. Black Knight data as of January 2023. Covers first lien mortgages
9 Source: Bloomberg. As of June 30, 2024
10 https://www.ft.com/content/f4208699-a3ea-4704-a621-0bbfee73f5f1
11 https://www.kansascityfed.org/ten/2023-summer-ten-magazine/assessing-important-shifts-in-the-worldwide-economy/
Disclaimer
ANY DESCRIPTION OR INFORMATION INVOLVING MODELS, INVESTMENT PROCESSES OR ALLOCATIONS IS PROVIDED FOR ILLUSTRATIVE PURPOSES ONLY AND DOES NOT CONSTITUTE INVESTMENT ADVICE NOR AN OFFER OR SOLLICITATION TO SUBSCRIBE FOR ANY SECURITY OR INTEREST. ANY STATEMENTS REGARDING CORRELATIONS OR MODES OR OTHER SIMILAR BEHAVIORS CONSTITUTE ONLY SUBJECTIVE VIEWS, ARE BASED UPON REASONABLE EXPECTATIONS OR BELIEFS, AND SHOULD NOT BE RELIED ON. ALL STATEMENTS HEREIN ARE SUBJECT TO CHANGE DUE TO A VARIETY OF FACTORS INCLUDING FLUCTUATING MARKET CONDITIONS AND INVOLVE INHERENT RISKS AND UNCERTAINTIES BOTH GENERIC AND SPECIFIC, MANY OF WHICH CANNOT BE PREDICTED OR QUANTIFIED AND ARE BEYOND CFM’S CONTROL. FUTURE EVIDENCE AND ACTUAL RESULTS OR PERFORMANCE COULD DIFFER MATERIALLY FROM THE INFORMATION SET FORTH IN, CONTEMPLATED BY OR UNDERLYING THE STATEMENTS HEREIN. CFM ACCEPTS NO LIABILITY FOR ANY INACCURATE, INCOMPLETE OR OMITTED INFORMATION OF ANY KIND OR ANY LOSSES CAUSED BY USING THIS INFORMATION. CFM DOES NOT GIVE ANY REPRESENTATION OR WARRANTY AS TO THE RELIABILITY OR ACCURACY OF THE INFORMATION CONTAINED IN THIS DOCUMENT.