There is broad consensus that the Federal Reserve (Fed) will announce a cut in interest rates following the 18-19 September 2024 FOMC meeting. At time of writing, a 25-bps cut is fully priced in, while the probability of a 50-bps cut is being priced at > 70%1. This consensus is based on an amalgamation of evidence that suggests inflation is cooling, that the tight US labor market is beginning to show signs of strain and finally that Fed chair, Jay Powell, pointed to the imminent start of rate cuts at the recent Jackson Hole conference.2
In anticipation of a shift towards looser monetary policy, we examine the typical reaction in financial markets around days where the Fed announces a change in the Fed funds target rate. Our sample stretches back to 1971.3
We zoom in and calculate the P&L of the two main asset classes, equities, and bonds, 120-days preceding and following a change in monetary policy. For equities we use the S&P 500 and for bonds the ICE BofA US Treasury Index as respective proxies.4
We also partition the analyses into prevailing economic ‘regimes’. We build a regime index using the same set of macroeconomic indicators the Business Cycle Dating Committee of the National Bureau of Economic Research (NBER) – the arbiter that determine US recessions – considers when determining turning points in the US economy5. Our indicator is an equally weighted, 36-month exponentially moving z-score of all these indicators. We quartile the values of our indicator with the 1st quartile (lowest values) akin to the economy in or approaching a ‘Trough’, the 2nd quartile a ‘Contraction’, the 3rd quartile an ‘Expansion’; and the 4th quartile (highest values) akin to the economy at or approaching a ‘Peak’.
It is around all FOMC action dates, narrowed to within each respective economic regime, where we inspect the market behavior of the asset classes. In figure 1 below we show our NBER regime indicator, and in what prevailing regime monetary policy action (cut or hike) was taken. The size of the bubbles indicates the size of the interest rate change.
To track the performance of the two asset classes before and after a change in the Fed funds rate, we calculate the daily percentage change of each asset class and remove the average daily return from the entire return time series. With this approach, the totality of all individual P&Ls, ±120-days from every other single day in our sample ~0. By extension, the average of all these P&Ls is also ~0. Thus, a P&L ±120-days from when the Fed cut or hiked shows the deviation of the asset class from the average (0) or the ‘typical’ performance of equities and bonds over any other given ±120-days period.
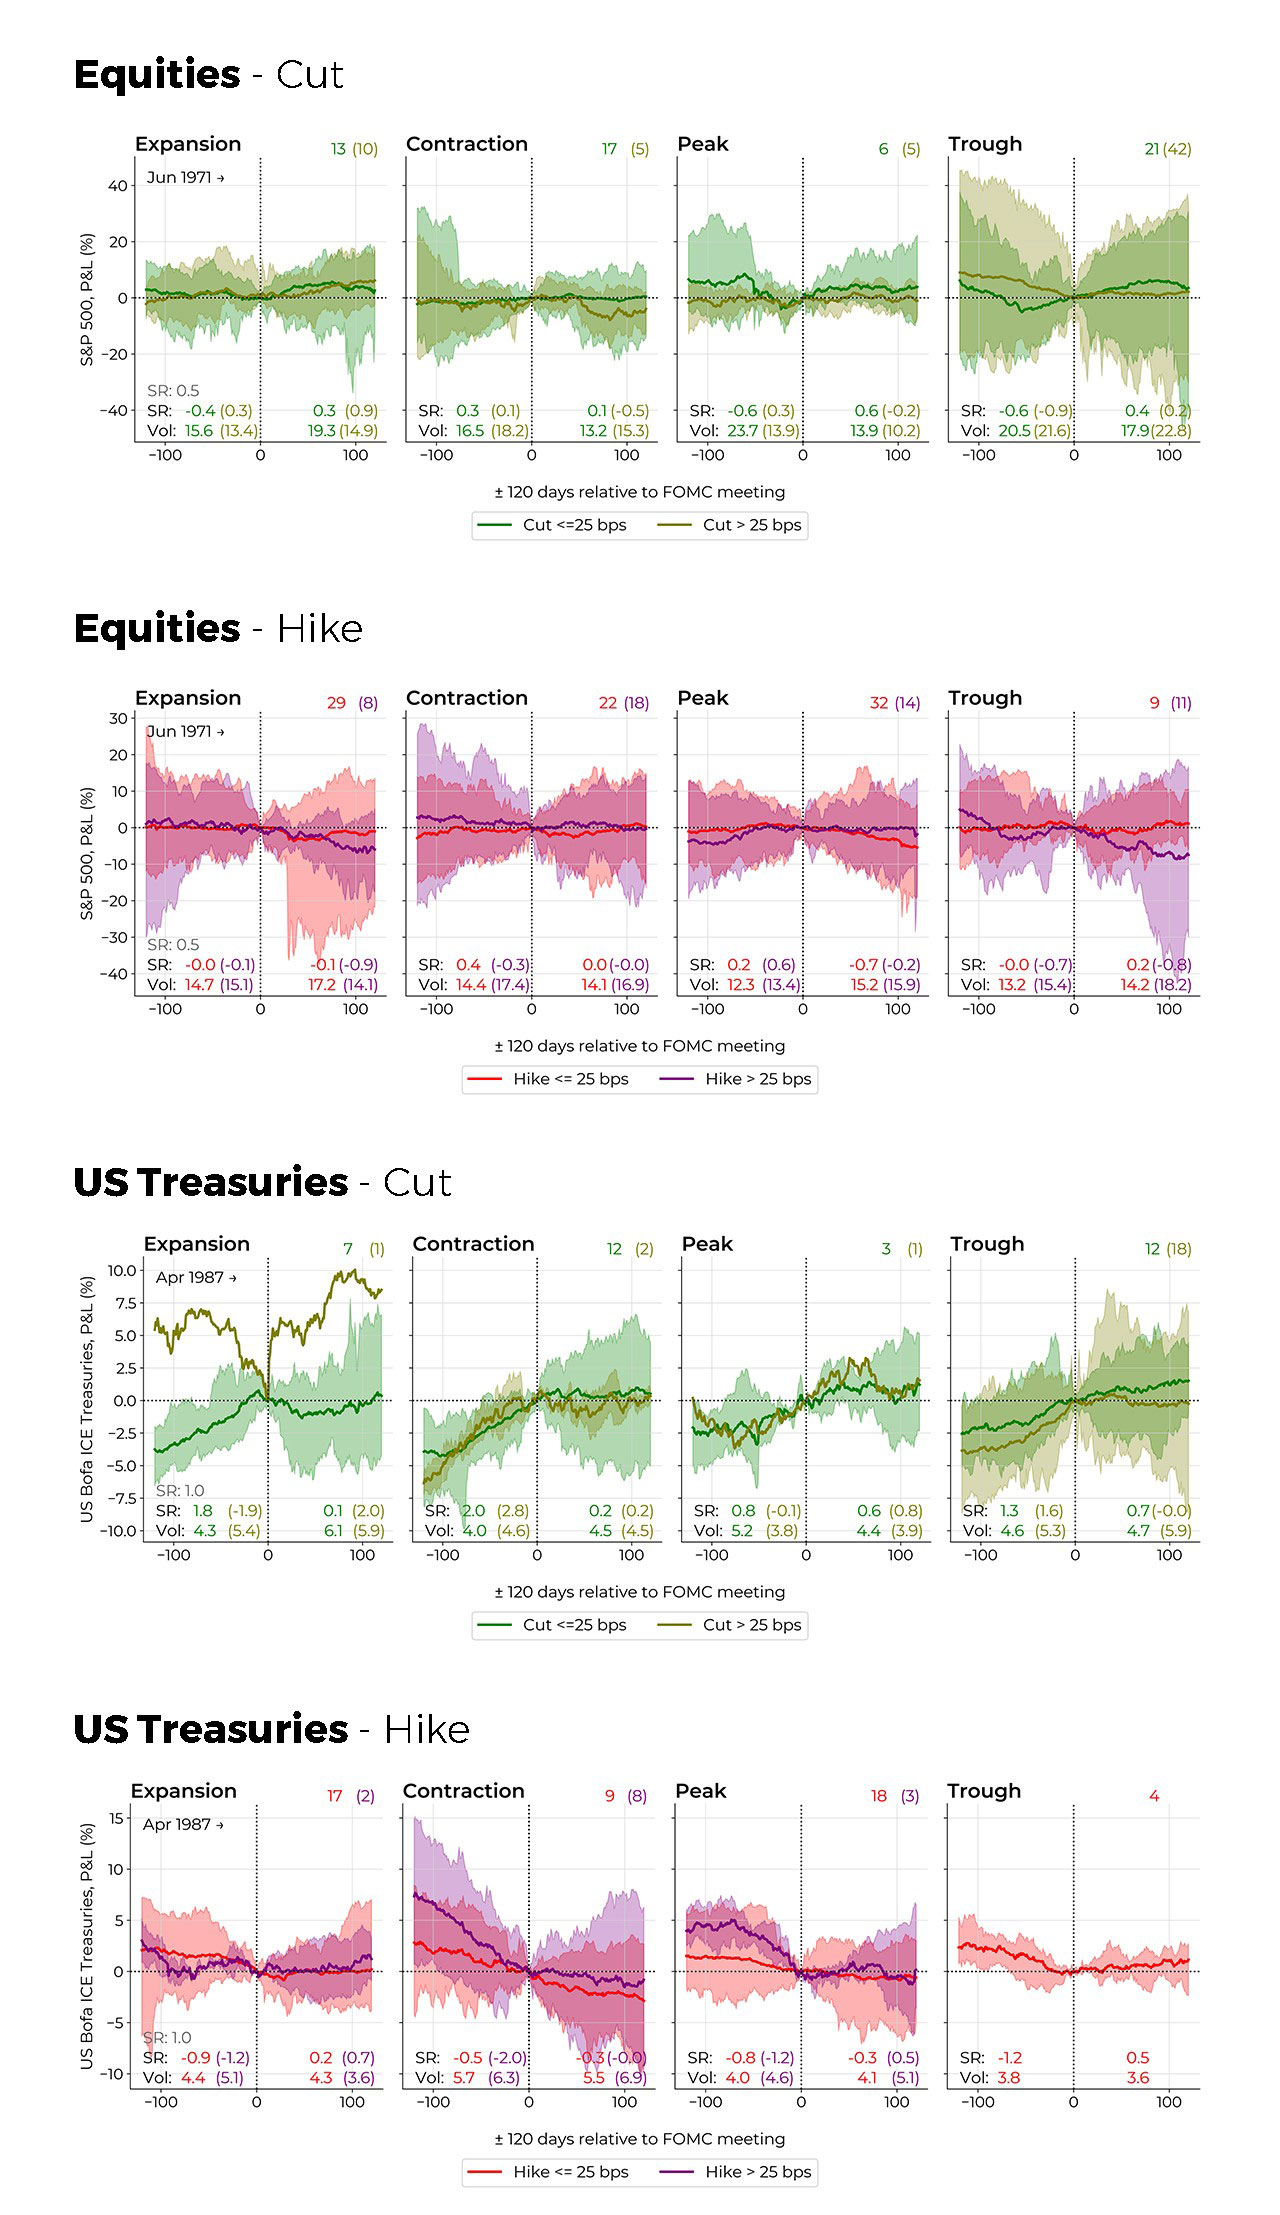
In figure 2 we plot the daily, mean equal to zero P&Ls of both asset classes, 120 days prior and post the announcement of a hike or cut assigned to each of the economic regimes. We divide the analysis into two subsets, when the hike or cut was either 25-bps or larger (as is being debated and priced as having a non-negligible probability for the upcoming September meeting).
Overall, our conclusion is that the average P&Ls should be viewed with a healthy degree of skepticism as the average P&Ls are clearly dominated by the large boundaries of the envelopes (i.e., noise). While monetary policy changes are important, there are, at any given point of time, a multitude of exogenous (and mostly endogenous…) effects that impact financial security returns.
Nevertheless, if we dare squint, we can discern a number of features around days where the FOMC take monetary policy action. For equities, and all else being equal, we typically, on average, see a positive deviation from 0 after a cut – supportive of a consensus that equities benefit from looser monetary policy. However, this feature is more often the case for a 25-bps cut, whereas bigger cuts, especially in a Contraction regime, on average, performed worse. The mean P&L curves for when the Fed favored a larger cut shows no significant positive deviation, except in an Expansion regime, suggesting that the S&P 500 does not benefit all that much from rate cuts in any other economic regimes. We observe the biggest effect pre-and-post effect after the Fed cuts rates by more than 25-bps when the economy is at or approaching a Trough – which should not be all that surprising.
On average, the opposite holds true for tightening, where larger hikes show greater deviation from 0 as opposed to the more habitual 25-bps action.
Equity volatility, on average, is higher than the long-term annualized volatility of the equity benchmark (~15%) coming into a cut, irrespective of the magnitude of the change. But, tends to ease post cut (except during an Expansion and Trough). Equity volatility is typically higher in periods around a cut than a hike but picks up after a hike.
Bonds, as equities, tend to perform better around cuts, especially coming into a cut. There seems, however, to be a near-universal flattening in returns post a cut (as can be observed in the kink of the slope of the average P&L) – this holding true (albeit with some idiosyncratic behavior) for any magnitude of cuts. The inverse holds when the Fed hikes. Bonds sell off sharply coming into a hike when the economy is in Contraction, probably reflecting heightened concerns over a deteriorating economic environment, persistent inflation and rising discount rates. Bond volatility in most cases, rises slightly after a cut, with a less consistent pattern before and after a hike.
Markets are anticipatory, reacting not just to the current rate changes but to expectations about future economic conditions, inflation, politics, geopolitical risks (etc.), and, of course the broader policy trajectory. This forward-looking practice (not even mentioning endogenous behavior) leads to significant dispersion in reactions across different economic environments, irrespective – as one might want to believe – the importance of occasional monetary policy action.
Key takeaways:
1. The market is discounting a better than even chance of a 50-bps cut at the upcoming September FOMC.
2. Yet, while some macroeconomic indicators point to a slowdown in growth, the US economy is generally in decent shape.
3. Our analysis shows that market behavior around FOMC policy days are dominated by noise. However, squint-eyed, we can make some qualified observations:
4. Different economic regimes affect the sensitivity of asset returns to monetary policy.
5. Rate cuts typically give a boost to equity returns, except when there is a larger than 25-bps cut after which equities tend to underperform compared to long-term historical averages; rate hikes lead to equity losses but are highly varying and dependent on the underlying economic regime. Strong economic conditions amplify the positive impact of cuts on equities; weak economic conditions increase the negative impact of hikes on equities.
6. Bonds tend to rally into a cut but revert to the mean afterwards. Bonds sell-off sharply coming into a hike, the sell-off amplified with weakening economic conditions (Contraction regime).
7. Bond traders are seemingly better at anticipating upcoming monetary policy adjustments, likely given it’s a first order effect on bond prices, and that equity markets are more fragmented vis-à-vis the Treasury market.
1 Data as of 16 September 2024, Bloomberg (as implied by Overnight Index Swaps). The probability of a 50-bps cut is back in play, and an already lively debate on whether the Fed will frontload cuts has gained further traction after the WSJ’s Nick Timiraos article published on September 12
2 See the transcript of Chair Powell’s speech here
3 The direct convertibility of US dollars into gold was terminated in 1971 by then President Nixon. The move away from a gold-backed currency towards fiat money necessitated different approaches to managing money supply and interest rates. Prior to this period, the Federal Reserve’s focus and monetary policy levers was different monetary aggregates rather than explicitly targeting the Federal Funds Rate as became the norm thereafter
4 SPX Index and G0Q0 Index for the S&P 500 and ICE BofA US Treasury Index respectively. Daily data for the S&P 500 is available from the start of the sample (1971), and for the ICE BofA US Treasury Index only from November 1986
5 The suite of data the Committee “consults” for determining the dates of US recession classification. See the dedicated page on Fred for further details.
6 The Sharpe ratio and volatility data is calculated using the demeaned returns series, but, are not excess returns. For excess returns the sharpe ratios would be even lower
Disclaimer
ANY DESCRIPTION OR INFORMATION INVOLVING MODELS, INVESTMENT PROCESSES OR ALLOCATIONS IS PROVIDED FOR ILLUSTRATIVE PURPOSES ONLY AND DOES NOT CONSTITUTE INVESTMENT ADVICE NOR AN OFFER OR SOLLICITATION TO SUBSCRIBE FOR ANY SECURITY OR INTEREST. ANY STATEMENTS REGARDING CORRELATIONS OR MODES OR OTHER SIMILAR BEHAVIORS CONSTITUTE ONLY SUBJECTIVE VIEWS, ARE BASED UPON REASONABLE EXPECTATIONS OR BELIEFS, AND SHOULD NOT BE RELIED ON. ALL STATEMENTS HEREIN ARE SUBJECT TO CHANGE DUE TO A VARIETY OF FACTORS INCLUDING FLUCTUATING MARKET CONDITIONS AND INVOLVE INHERENT RISKS AND UNCERTAINTIES BOTH GENERIC AND SPECIFIC, MANY OF WHICH CANNOT BE PREDICTED OR QUANTIFIED AND ARE BEYOND CFM’S CONTROL. FUTURE EVIDENCE AND ACTUAL RESULTS OR PERFORMANCE COULD DIFFER MATERIALLY FROM THE INFORMATION SET FORTH IN, CONTEMPLATED BY OR UNDERLYING THE STATEMENTS HEREIN. CFM ACCEPTS NO LIABILITY FOR ANY INACCURATE, INCOMPLETE OR OMITTED INFORMATION OF ANY KIND OR ANY LOSSES CAUSED BY USING THIS INFORMATION. CFM DOES NOT GIVE ANY REPRESENTATION OR WARRANTY AS TO THE RELIABILITY OR ACCURACY OF THE INFORMATION CONTAINED IN THIS DOCUMENT.